The Call Queue Progression dashboard provides detailed analytics on incoming calls, tracking the progression from the initial call to initiating a Verification of Benefits (VOB) and its eventual conversion to a treatment opportunity.
Note: The data refresh process for the BI analytics will occur every 5 hours.
Requirements
The user profile must have access to marketing analytics.
Important: For guidance on how to obtain access to Kipu BI reporting, please click here.
Accessing BI Report
To access the Referral Activity dashboard, please navigate to Analytics > Kipu BI > Call Queue Progression.
Filter Controls
Please see below for a complete breakdown of the available filters on this dashboard.
- Caller Name: Used to filter the data by the caller ID tied to the phone call.
- Time of Call: Used to specify a particular timeframe of call records that were captured by your organization in the CRM.
- Hour: Filters data based on the hour of the day (0-23) when the call occurred.
- Weekday: Filters data based on the day of the week when the call occurred.
- Campaign: Used to filter the data based on the campaign that the tracking number is associated too.
- Marketing Event: Used to filter the data based on the marketing event that the tracking number is tied too.
- Tag(s): Filters data to showcase call records with specific tags that were applied in your call tracking provider platform.
- Last Modified By: Filters data based on the user that last performed changes to the call record.
- Admitted?: Filters data to display call records that resulted in an admitted patient.
- Disposition: Used to filter the data to only show call records that contain a specific disposition(s).
- Admit Date: Filters data to display call records that led to an admission in the specified time frame.
- Google Click ID Present: Filters data to display call records that have a Google Click ID associated.
- Opportunity Tag(s): Filters data based on the specified opportunity tags applied to the treatment opportunity associated with the call record.
- Insurance Position: Filters data based on the designated insurance position associated to the patient record. (Primary, Secondary, Tertiary, Carve Out)
- Payor: Filters data based on the specific insurance companies that are tied to the patient record.
- Facility: Filters data based on the facility assigned to the patient record.
-
Time Zone: Designate a specific timezone for the system to adhere to for all date/time values presented in the dashboard.
Reporting Widgets
For a detailed breakdown of all reporting widgets available on this dashboard, please refer to the section below.
Important: Drill-down functionality is available for all users by simply clicking on any elements present in the reporting widgets.
-
Total # of Calls: This widget displays the total number of call records captured by the CRM.
-
Total # of Unique Callers: This widget displays the total number of unique callers captured by the CRM based on their phone numbers.
- # of Opportunities Created to # of Calls Received: This widget represents the percentage of opportunities created relative to the number of calls received.
- # of Admits Compared to # of Calls Received: This widget represents the percentage of admits recorded relative to the number of calls received.
- # of Instant VOBs Created vs # of Unique Calls: This widget represents the percentage of Instant VOBs created relative to the number of unique calls received.
- # of Phone VOBs Created vs # of Unique Calls: This widget displays the percentage of Phone VOB requests created relative to the number of unique calls received.
- # of Instant VOBs Created vs # of Opportunities: This widget displays the percentage of Instant VOBs created relative to the total number of treatment opportunities created.
- # of Phone VOBs Created vs # of Opportunities: This widget represents the percentage of phone VOBs created relative to the total number of treatment opportunities created.
- # of Opportunities Created compared to # of Unique Phone Numbers: This widget represents the percentage of treatment opportunities created relative to the total number of unique phone calls that were received.
- # of Admits compared to # of Unique Phone Numbers: This widget represents the percentage of admits recorded relative to the total number of unique phone calls that were received.
- # of Calls by Day of Week: This widget displays call volume statistics broken down by day of the week using a donut chart visualization.
- # of Calls by Hour: This widget presents the total number of calls received for each hour of the day.
- # of Instant VOBs by Hour: This widget displays the total number of instant VOBs performed for each hour of the day.
- # of Phone VOBs by Hour: This widget displays the total number of phone VOBs performed for each hour of the day.
Reports
Call Queue Progression Detailed Data 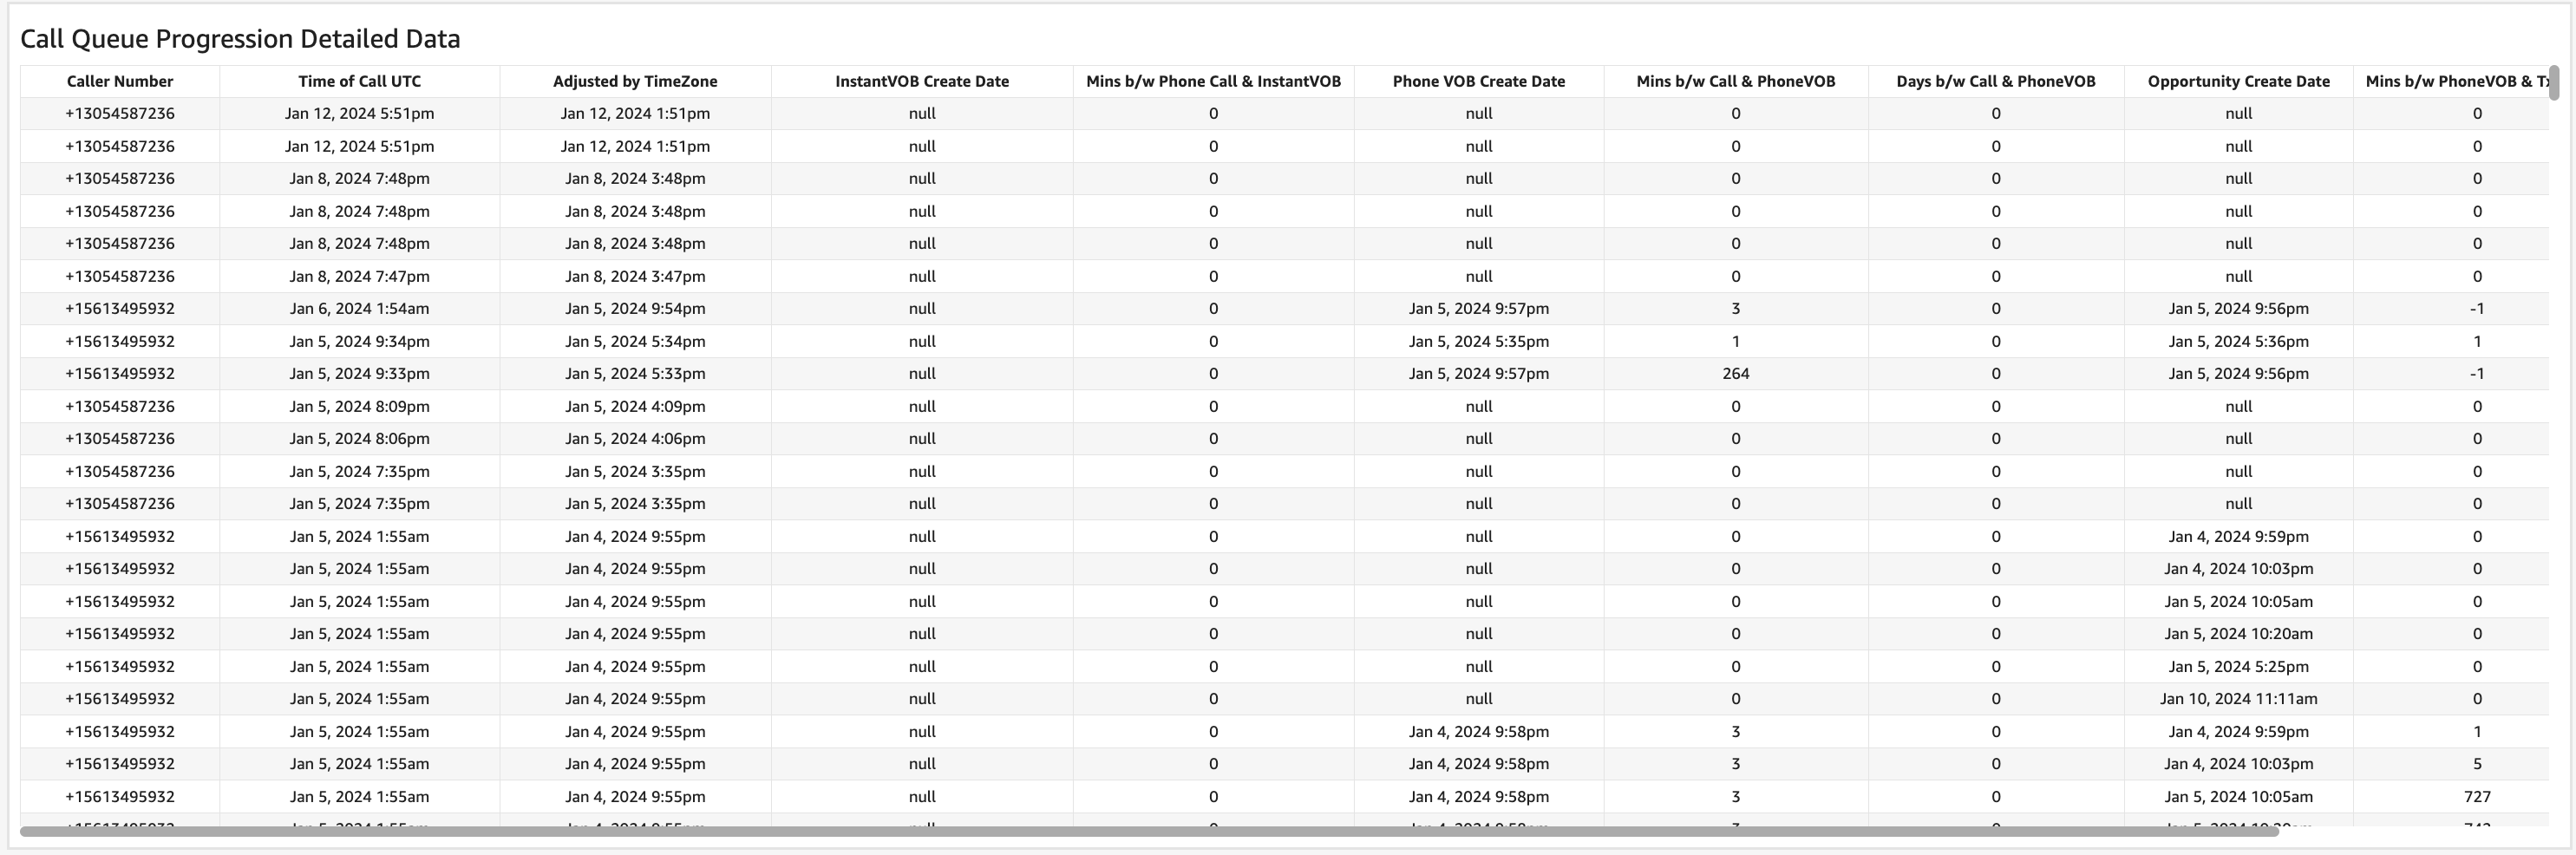
For a detailed breakdown of all available data points on the Call Queue Progression Detailed Data report, please refer to the below.
- Caller Number
- Time of Call UTC
- Adjusted by Time Zone
- Instant VOB Create Date
- Minutes between Phone Call & Instant VOB
- Phone VOB Create Date
- Minutes between Call & Phone VOB
- Days between Call & Phone VOB
- Opportunity Create Date
- Minutes between Phone VOB & Treatment Opportunity
- Days between Phone VOB & Treatment Opportunity
- Provider Campaign
Important: For this data to populate accurately, patient records must be created through the call queue, and the call record must be linked to their corresponding treatment opportunity. For more information on Call Queue processing, please click here.
Average Call Progression by Day 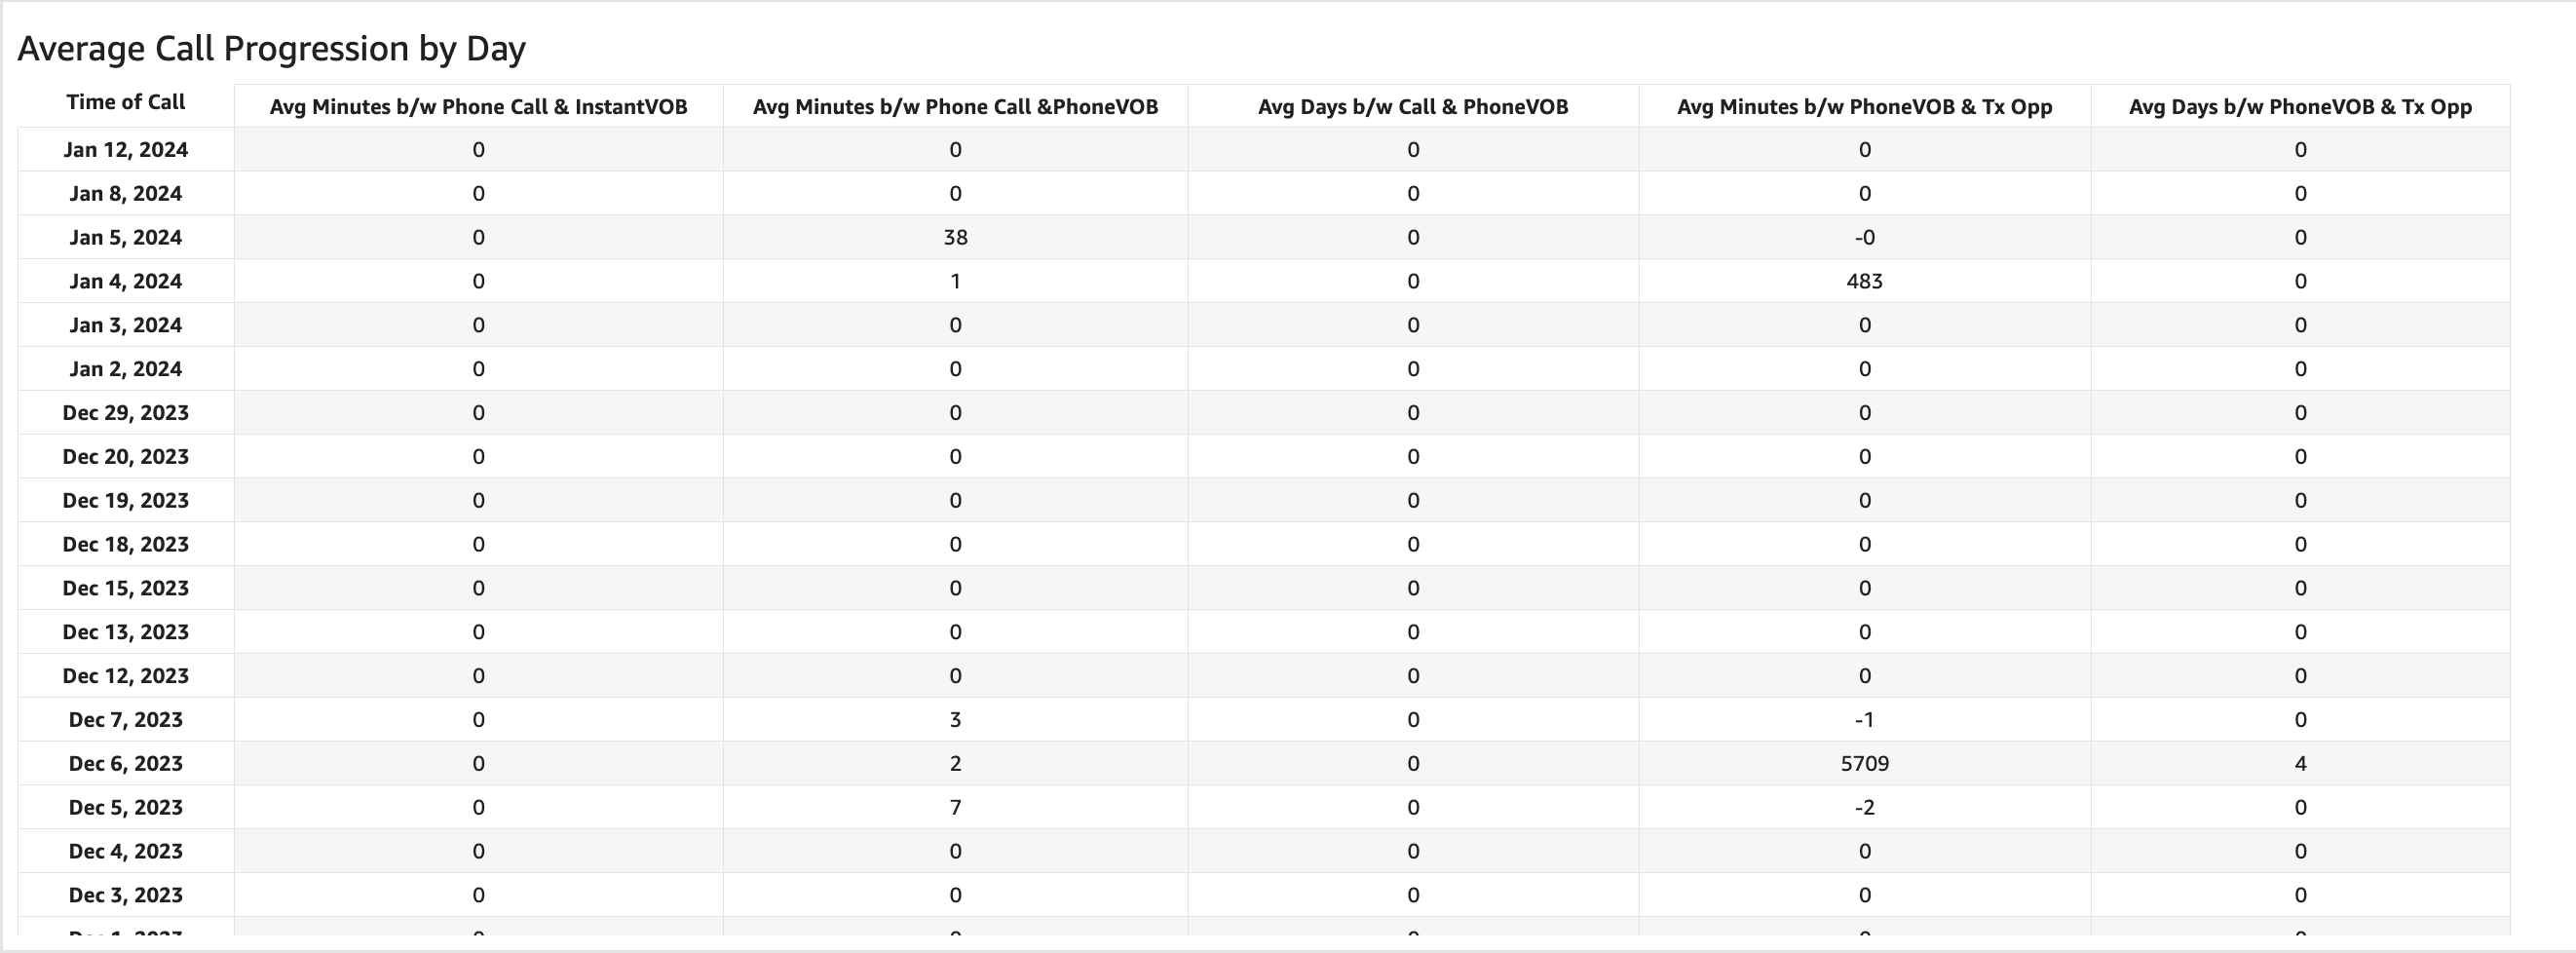
For a detailed breakdown of all available data points on the average call progression by day report, please refer to the below.
- Time of Call
-
Average Minutes between Phone Call & Instant VOB
- Represents the average number of minutes between the time of the call in the Call Queue and when the Instant VOB occurred
- The call record must be associated with the patient record to be included. The opportunity record is not taken into account.
-
Average Minutes between Phone Call & Phone VOB
- Represents the average number of minutes between the time of the call in the Call Queue and when the Phone VOB was placed in the queue
- The call record must be associated with the patient record to be included. The opportunity record is not taken into account.
-
Average Days between Phone Call & Phone VOB
- Same calculation as “Avg Minutes between Phone Call & Phone VOB”, but it represents days instead of minutes.
-
Average Minutes between Phone VOB & Treatment Opportunity
- Represents the average number of minutes between when the Phone VOB was placed in the queue and when the opportunity was created.
- The call record must be associated with the patient and the opportunity record to be included.
-
Average Days between Phone VOB & Treatment Opportunity
- Same calculation as “Avg Minutes between Phone VOB & Tx Opp”, but it represents days instead of minutes.
Please note, only incoming calls are included in these metrics for the average call progression by day widget.
Call Detail Data 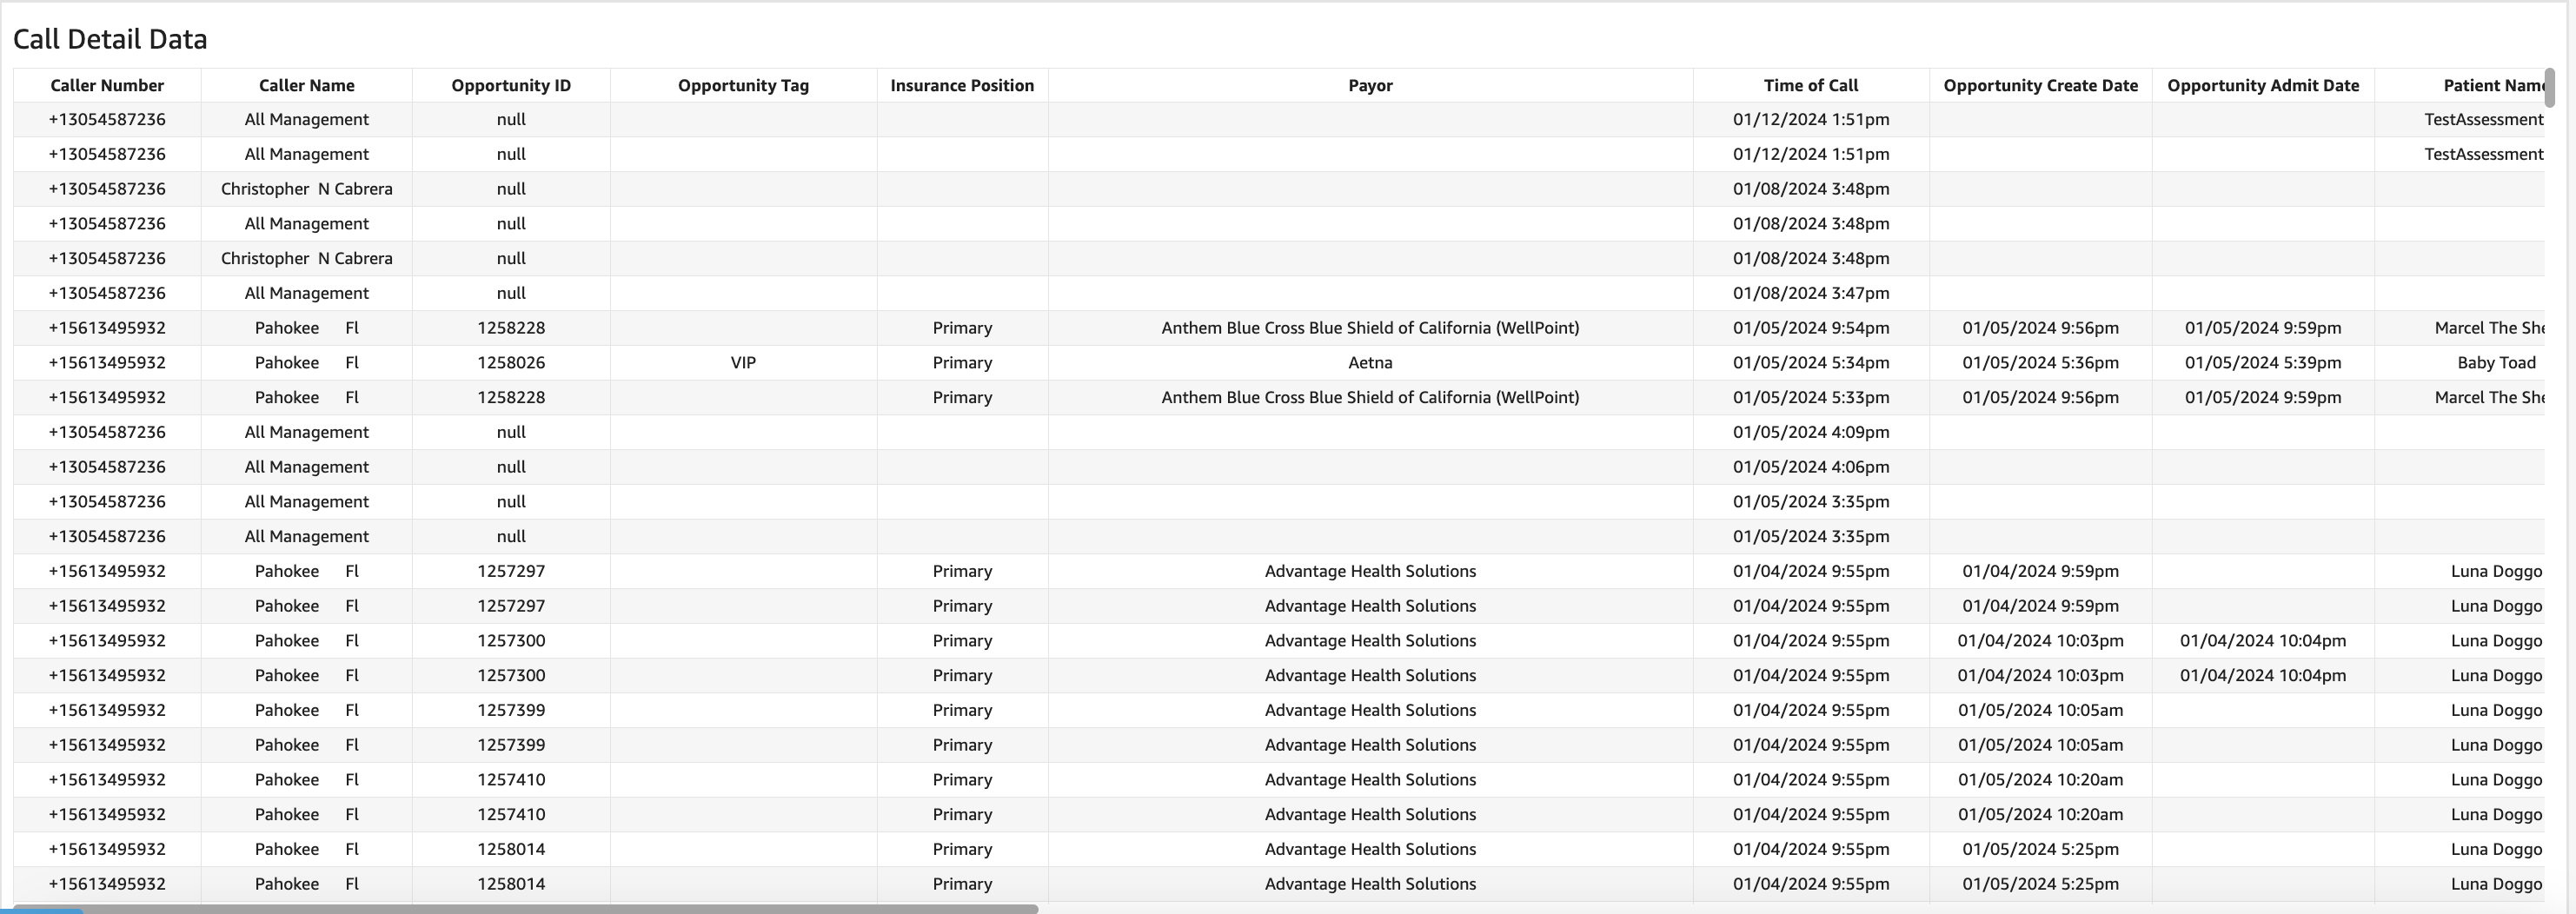
For a detailed breakdown of all available data points on the Call Detail Data report, please refer to the below.
- Caller Number
- Caller Name
- Opportunity ID
- Opportunity Tag
- Insurance Position
- Payor
- Time of Call
- Opportunity Create Date
- Opportunity Admit Date
- Patient Name
- Facility
- Disposition
- Relationship
- Campaign
- Marketing Event
- Google Click ID
- Tracking Source
- Tag
- Landing Page URL
- Last Requested URL
- Referring URL
- GCLID Present?
- Is Admitted
- Provider Campaign