The Demographic Analysis dashboard provides comprehensive insights into key demographic information related to patient records in the system. This report includes detailed data on patients’ sex, gender identity, ethnicity, race, marital status, insurance details, and payment methods, among other demographics. It enables users to understand the diverse backgrounds and characteristics of their patient population, facilitating better-informed decisions and targeted interventions.
Note: The data refresh process for the BI analytics will occur every 5 hours.
Requirements
User Profile must have access to prospect analytics reports.
Important: For guidance on how to obtain access to Kipu BI reporting, please click here.
Accessing BI Report
- Select Analytics > Kipu BI > Demographic Analysis.
Filter Controls
For a complete breakdown of the available filters present on this dashboard, please see below.
- Patient Name: Specify a patient or patients for Demographic examination.
- Patient Status: Used to specify a particular patient record status (Client, Discharged, Lead, Obsolete, Opts in for Alumni / Aftercare, Opts Out for Alumni / Aftercare, Patient, Prospect, Unknown Lead).
- Tag: Filters data based on the Tag applied to the patient record.
- Create Date: Filters data based creation date of the patient record.
- Time Zone: Designate a specific timezone for the system to adhere to for all date/time values presented in the dashboard.
Reporting Widgets
For a detailed breakdown of all reporting widgets available on this dashboard, please refer to the section below.
-
Patients by Facility: This widget displays the total # of patient records per facility present in the Kipu CRM.
-
Patients Created by Date: This widget displays the number of patient records created, categorized by the year of creation.
-
Patients by Status: This widget features a word cloud visualization of the record statuses assigned to patients in your system. The size of each word corresponds to the frequency of that status, with the largest word representing the status applied to the most patient records.
-
Patients by Sex: This widget presents a pie chart visualization of the sex distribution of patients in your system. The size of each segment visually represents the proportion of patients in each category.
-
Identifies As: This widget presents a pie chart that breaks down the gender identity of patients as recorded in the system. Each segment is annotated with the count and percentage of patients.
-
Patients by Ethnicity: This widget illustrates the distribution of patient records based on ethnicity. It provides a visual representation of the ethnic composition in the patient population.
-
Patients by Race: This widget displays the distribution of patient records categorized by race as documented in the system. It provides a visual representation of the racial composition of the patient population.
-
Patients by Marital Status: This widget uses a horizontal bar chart to display a breakdown of patients based on their recorded marital status. It provides a clear visual representation of the distribution of marital statuses in the patient population.
-
Insurance Category: This widget provides a detailed breakdown of patient records categorized by the type of insurance policy on file. It offers a visual representation of how patient records are distributed among different insurance categories, helping users quickly understand the insurance coverage landscape in the system.
-
Payment Method: This widget offers a comprehensive breakdown of the various payment methods recorded across patient records in the system. It visually represents the distribution of payment methods, allowing users to easily analyze and understand the mix of payment options utilized.
-
# of Patients by Payor: This table displays the total number of patient records associated with each insurance company, based on the insurance policies documented in the system. It provides a clear overview of how patient records are distributed across different insurance payors.
-
# of Patients by Province: This bar graph shows the total number of patient records sorted by the state or province of residence, as indicated in the address records documented in the system. It provides a visual representation of patient distribution across different geographic regions.
-
Breakdown by Age: This widget displays the age distribution of patient records in the system. It visually represents how patients are grouped across different age ranges, providing insights into the demographic composition of the patient population.
-
Breakdown by Age Grouping and Gender: This widget provides a detailed view of the patient population, breaking down age groups and further segmenting them by gender. It offers insights to the demographic distribution of patients, highlighting both age and gender composition in the system.
-
Payment Plan Eligible: This widget displays the number of patient records categorized as either eligible or ineligible for payment plans. It provides a clear overview of how many patients qualify for payment plans compared to those who do not.
-
Payment Plan in Place: This widget shows the number of patient records with an active payment plan compared to those without one.
-
Employment Status: This horizontal bar graph shows the distribution of patient records based on documented employment status. It visually represents how patients are categorized by their employment situation in the system.
-
Current Student Status: This graph illustrates the number of patient records segmented by their current student status.
-
Highest Education: This widget displays the number of patient records categorized by the highest level of education achieved. It provides a visual representation of the educational attainment across the patient population.
Reports
See below for a detailed breakdown of all available data points on the patient detail report.
Patient Detail 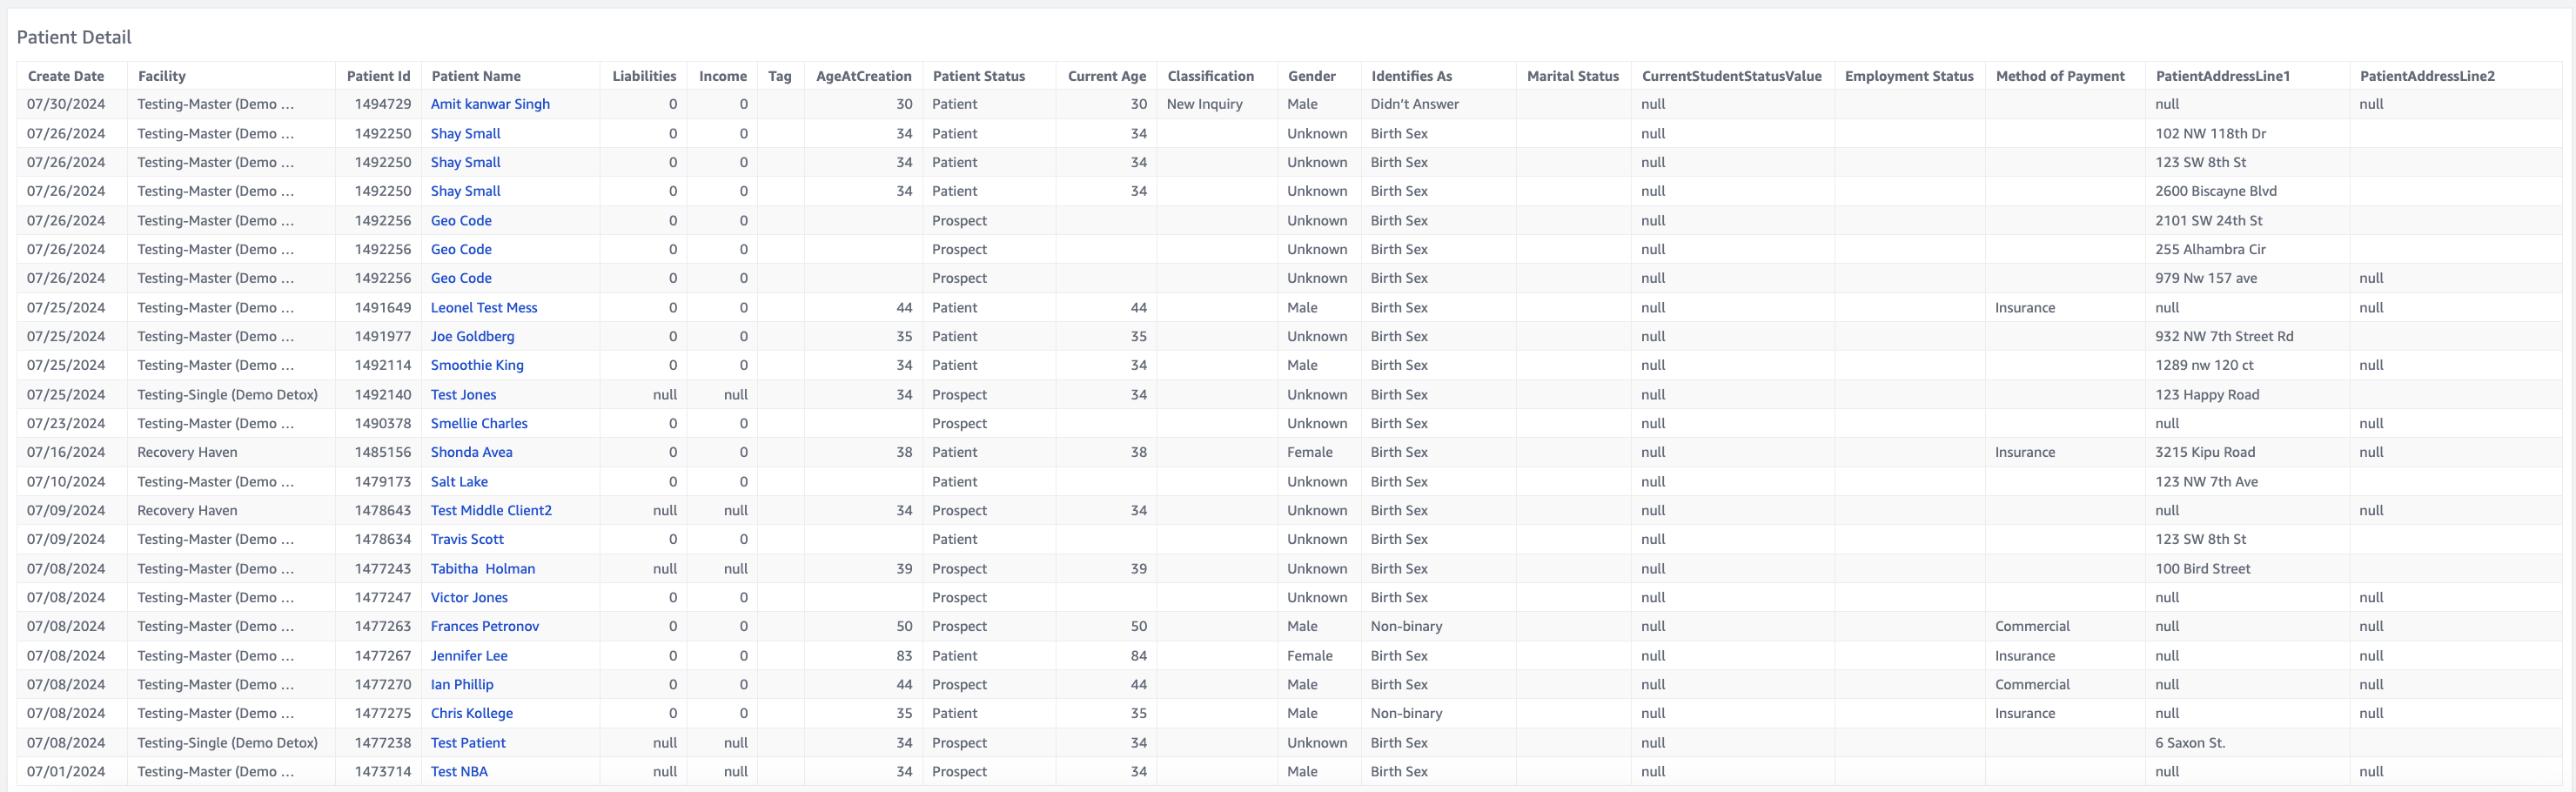
- Create Date
- Facility
- Patient ID
- Patient Name
- Liabilities
- Income
- Tag
- Age at Creation
- Patient Status
- Current Age
- Classification
- Gender
- Identifies As
- Marital Status
- Current Student Status
- Employment Status
- Method of Payment
- Patient Address Line 1
- Patient Address Line 2
- Patient Address City
- Patient Address State
- Patient Address Zip
- Patient Address Country
- Patient Address Type
- Last Refresh Date
- Ethnicity
- Race
- Insurance Position